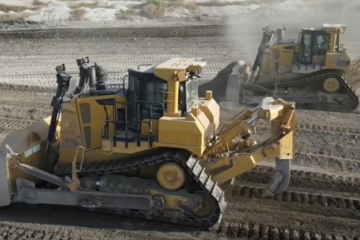
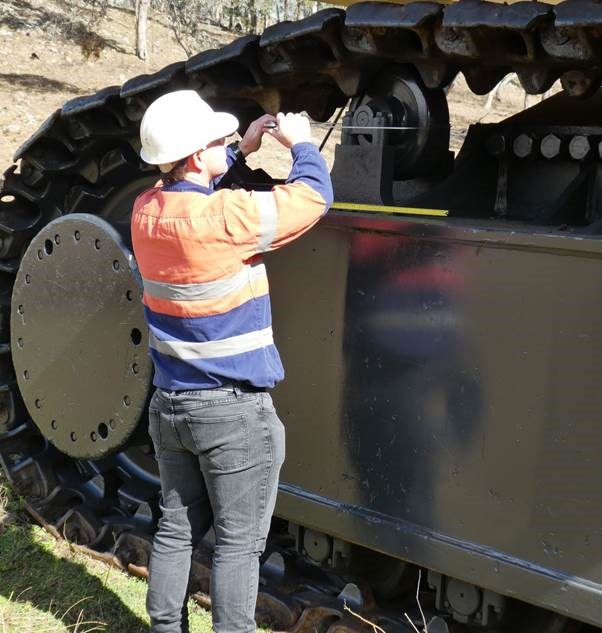
Undercarriage Inspection data provides the basis of equipment condition monitoring and drives the decisions to repair and/or replace components. These are the day to day tasks handled by the TrackTreads system, but there is so much more.
The lost value associated with the old chain is the 10% of wear and hours still available, being $50,000 X 10% = $5,000.
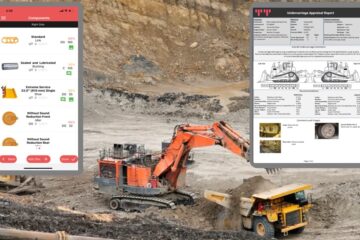
Analytical analysis of the Data built up through successive inspections also provides insights into the cost effectiveness and appropriate selection of components.
Take for instance, link bush and shoe wear monitored over successive inspections, the analytics generated include Cost per Hour. The analytics would also provide an accurate cost incorporating all repairs and replacements and could be compared across multiple machines, at a component level or at chain level. Where a fleet of the same machine is large, with a good spread of inspections, benchmarks can be established for:-
- the Cost per hour
- the average hours to 100% worn by season
- average hours achieved or benchmark performance by different brands of components and from this then the best combination of components to operate in given environment
- the best point to complete a pin and bush turn, shoe swap or other action.
This is only a small fraction of the analytics possible with the TrackTreads system, and it all starts with collecting inspection data. The modern world is driven by data collection systems, but the data is only part of the equation. Analysis of the data to extract valuable information to drive smart decisions is the way of the future and many mining companies are already embracing this technology.
To get further information and arrange a free demontration simply fill in the form below.
[contact-form-7 id=”2772″]