The future profitability of mining or construction, as with any businesses, lies in the effective use of Business Intelligence. BI isn’t just your data, it’s the information you get from effectively analysing your data. It’s the ability to take large, and often very large datasets, and distil them down to the key performance indicators and other relevant metrics that drive efficiency and profitability.
A simple example for machine undercarriage is the collection of inspection data. Successive inspections on the same machine within a fleet enable trends to be developed from the inspection records which then allow the accurate calculation of a number of important data points such as: –
- Actual hours being achieved to 100% worn of installed components
- Hours performance of the different components and how they either match or mismatch at 100% worn
- At what hours should certain actions be taken so that the entire undercarriage system can achieve 100% worn at close to the same point
- Calculate the cost per hour for each component as well as the entire undercarriage system on each machine and establish a benchmark
- The combination of branded components works best in current jobsite environment and season of the year.
This is only the beginning though. Good inspection data can also be used to identify things like operator skill deficiencies, repair and replacement processes that are costing more than they should, sales and purchasing opportunities, staff performance…the list goes on.
Mining these performance metrics and indicators is where the traditional static PDF report becomes inadequate. Machine health reports as a PDF will always have a place, but how do you properly extract and analyse the data from hundreds, if not thousands of PDF files? The short answer is, you don’t.
You could enter everything into a spreadsheet every time you receive a PDF report. Spreadsheets are undeniably a great tool for analysing and graphing datasets, but not only is it tedious and labour intensive to transcribe everything from PDF files, spreadsheets simply aren’t designed to be storing the quantities of data required for real in depth data collection over long periods of time. The longer you collect data the better results you can get from analysis, but the more unwieldly it becomes when stored in a Spreadsheet. Undercarriage averages about 30 components per machine, if you do 50 inspections on 100 machines, you are already up to 150,000 inspection records, and that is just the component measurements. The add additional observations and images, the images would have to be kept separately of course and individually liked in to each record. Imagine trying to open a spreadsheet with that many records and links in it.
Databases are the ideal tool for collecting, storing, manipulating and exporting data for analysis. A good database wouldn’t even hiccup with 150,000 records, or even a million. Generally when we think databases however, we don’t think user friendly, and that’s the problem.
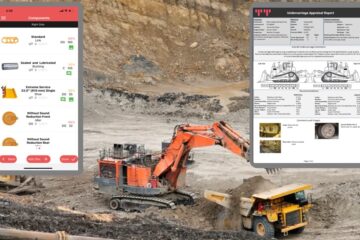
So what about a Web and/or mobile application? These work wonderfully for entering data and doing basic searching, sorting and reporting, but they aren’t the best for doing broad analysis and customised dataset export for analysis.
So what’s the Solution?
The best solution is to use them all in an integrated manner where each one is used for what it does best.
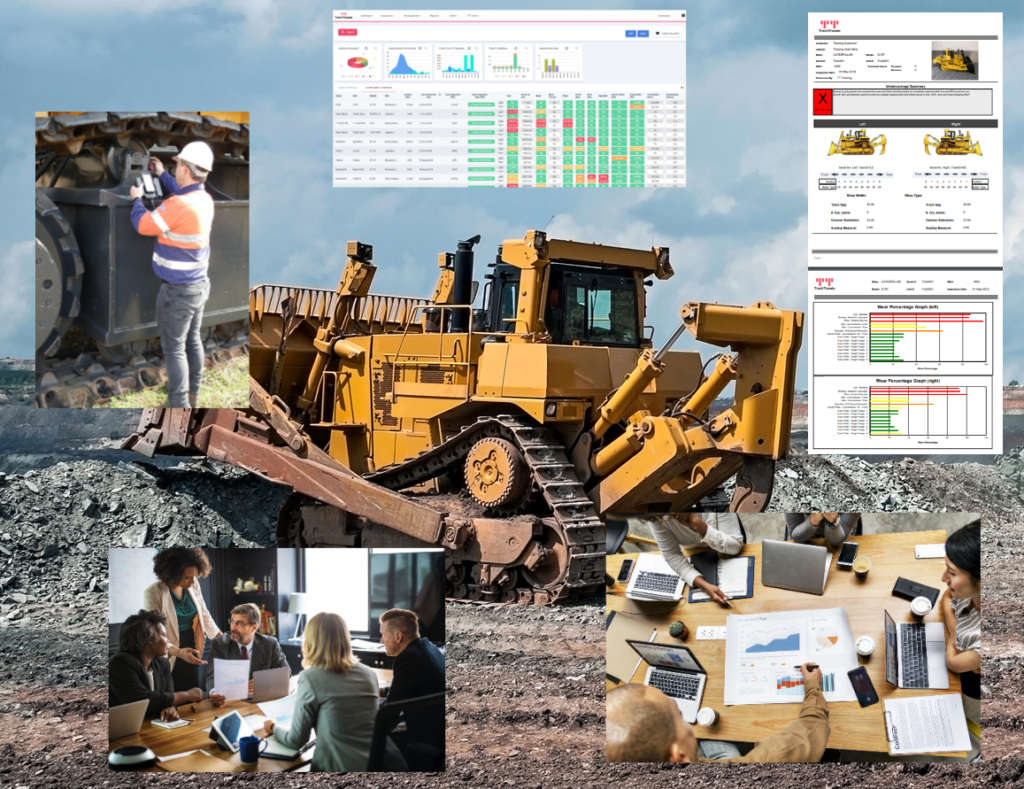
Use Web and Mobile Apps to capture/enter the data into enterprise database systems that can easily handle all the data you can throw at them. Use the same applications for all your day to day sorting and searching and generate great looking PDF reports as required. When it comes time to delve into the in depth analysis, have the database system select and sort the data you need for the current analysis task and export it to a spreadsheet where you can slice and dice it, generate graphs to your hearts’ content and then maybe even drop it into a presentation to wow everyone at your next productivity meeting.
The TrackTreads system is built on a solid database foundation, has a mobile app for collecting in the field inspection data and a comprehensive web app where you can do the day to day equipment condition analysis and yes, produce the ever usefull PDF reports. Beyond this, TrackTreads can also provide automated scheduled exports of datasets that you can design and integrate into your larger BI processes.
To get further information and arrange a free demontration simply fill in the form below.
[contact-form-7 id=”2772″]