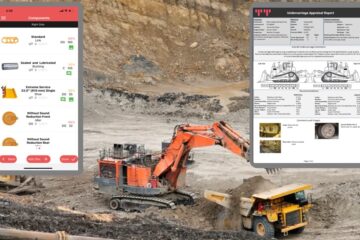
Are you managing undercarriage data with spreadsheets? Do you spend lots of time preparing the data so that you can then manage and make decisions? If you do, you are not alone!
The reason for this is simple! The tools for inspecting, measuring and managing the undercarriage inspection results are not readily available. The next best option is MS Excel, with lots of manual data entry and spreadsheet manipulation. Sound familiar to you?
This is not nearly enough to manage undercarriage, which is often a complicated system and a large expense on tracked machines. On production dozers for example, this cost can be greater than 50% of the overall maintenance costs!
MS Excel has its uses and its limitations
Positives
- MS Excel can be manipulated easily and has strong graphing capabilities.
- Most people have a reasonable working knowledge of Excel, little further training required.
Negatives
- It’s not a good database tool.
- Excel does not connect your data tables to one another automatically.
- Excel does not handle one-to-many relationships well.
- More labour intensive to collect data in the field and then transfer to the spreadsheet, then manipulate it into a usable format.
- Mistakes can be made easily in calculating the percent worn.
- It is hard to restrict access for different users, and only one user can effectively work at a time.
- Difficult to share across multiple job sites and then have multiple users entering data.
- Difficult to standardise inspection data entry format along with the calculation of percent worn and residual lives.
- Recording events with costs becomes trickier as managed often by different maintenance groups.
- Harder to aggregate data.
- Forecasting is also harder.
Users wanting to manage undercarriage effectively need as a basic requirement a database that can
- Cover all makes and models of machines so that the entire fleet can be managed, not just a single brand of machine. The OEM method of calculation must always be used regardless of make of component.
- Needs to be able to accommodate all tools used to measure wear surfaces.
- Standardise inspection input/collection format.
- Collect inspection data remotely, validate the data and collect comments and images. Then need to easily sync this with the database with minimal human intervention to avoid errors.
- View inspection results and make decisions on different scenarios that can be done to maximise the life of the components and match the entire system life. This needs to be viewed within reasonable maintenance schedules for the machine.
- Keep all equipment and component events so that machine hours and component hours are automatically calculated and updated.
- Keep records of all costs of events when components are swapped, replaced or repaired.
- Easily move chains from one machine to another while tracking the chains complete history of where it has been, repair and replacement events and costs.
- View the fleet quickly with immediate updates as inspection data entered.
- Aggregate data so that trends can be seen in component life performance and cost per hour performance.
- Use aggregated performance data for quoting on potential mining contracts.
Once these tools are in place, managers of undercarriage can move from the task of entering and manipulating data to the task of managing and planning based on the results of the data.
To request a demonstration of how the TrackTreads software can benefit you, Contact Us


0 Comments